Analytics and Data · June 21, 2026
Data-Driven Product-Market Fit: Quantitative Tools for Your UK Innovator Visa Application
Explore quantitative methods and data analytics to measure product-market fit and optimise your UK Innovator Visa business plan performance.

Kickstart Your Innovation with Data-Driven Insight
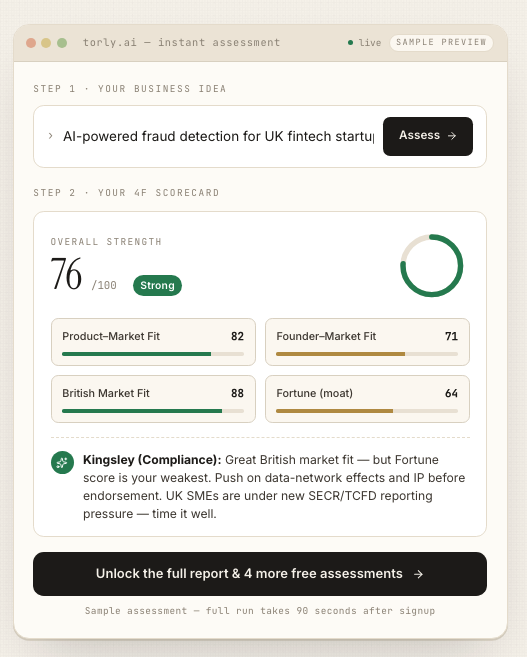
For any entrepreneur aiming at a UK Innovator Visa, securing product-market fit is the golden ticket. Instead of guessing if your idea will land, you quantify every signal: retention curves, expansion rates, churn metrics. By turning gut feeling into data, you speak the Home Office’s language and win endorsements faster. In fact, you can already Explore Product Market Fit with our AI-Powered UK Innovator Visa Application Assistant for a guided, automated deep-dive into your venture’s traction.
In this guide, we unpack three core quantitative frameworks for measuring product-market fit: growth accounting, customer cohorts and distribution analysis. You’ll see practical steps, real examples and clear charts (imagine them in your plan) that bring numbers to life. Plus, discover how Torly.ai’s AI-powered Innovator Visa assistant folds these analytics into a bespoke business plan with 24/7 support, a 95% approval success rate and tailored documentation in just 48 hours.
Why Quantitative Product-Market Fit Matters for Innovator Visa Plans
Showing solid product-market fit in your Innovator Visa application demonstrates you’ve tested a real opportunity, not just an unverified idea. The Home Office and endorsing bodies want proof you’re solving a genuine problem at scale. Subjective claims like “high demand” or “excited customers” won’t cut it. Instead, you need:
• Numerical evidence of growth
• Cohort insights that reveal long-term retention
• Distribution metrics that show which customer segments drive value
Without a clear data story, even the most innovative concept can stall in review. Using quantitative tools, you turn your narrative into numbers, making your application precise, persuasive and proof-backed.
Growth Accounting: Break Down Your Revenue Drivers
Growth accounting slices your overall revenue change into meaningful categories. Think of it as a financial income statement for product traction. Key buckets include:
- New revenue: from brand-new customers
- Retained revenue: carried over from existing customers
- Expansion: upsells or higher spend by existing users
- Contraction: downgrades or smaller spend
- Churn: customers who dropped to zero
- Resurrected: lapsed customers who re-engaged
With these definitions you can compute metrics like:
- Gross retention = retained revenue / last period revenue
- Quick ratio = (new + expansion + resurrected) ÷ (churn + contraction)
- Net churn = (churn + contraction – expansion – resurrected) / last period revenue
A healthy visa applicant plan often shows a quick ratio above 1.5x and negative net churn (meaning expansion outpaces losses). These hard numbers—plotted over time—help endorsers see a clear upward trajectory. To integrate your revenue data into your Innovator Visa dossier, you can even Download BP Build Desktop APP for seamless analytics.
Customer Cohort Analysis: Track Traction Over Time
Cohorts group customers by the period they first transacted or engaged. Analysing cohort behaviour lets you spot improvements in onboarding, product updates or pricing changes. Common cohort metrics are:
- Lifetime value (LTV): cumulative revenue per customer after X months
- Revenue retention: percentage of original cohort spend still active after X months
- Logo retention: percentage of customers still active after X months
Visualise by plotting LTV curves for each monthly cohort. Look for “super-linear” shapes—where older cohorts spend more over time—that signal strong product-market fit. Or use heatmaps to catch seasonality and sudden drops.
Clear cohort charts reassure visa endorsers you know exactly how customers stick with your product. And if you need hands-free analytics, our TorlyAI Desktop APP plugs directly into your data warehouse.
Mapping Distribution to Reveal Your Core Market
Beyond averages, distribution analysis shows you where the real value lies. Plot a cumulative distribution function (CDF) of monthly revenue per customer:
- The x-axis is revenue amount (often on a log scale)
- The y-axis shows what share of customers or revenue falls below that amount
For example, if 80% of customers spend under £1,000 and they only deliver 40% of revenue, you know your top 20% of customers are critical. You can tailor your Innovator Visa narrative to emphasise scalable retention strategies among that top quintile.
Or flip the analysis to user engagement—like days active per month (L28)—to prove product-market fit through stickiness. When only a small fraction of users drive nearly all interaction, it highlights both growth potential and the need for targeted acquisition. For an automated distribution report, try our Your AI-powered assistant for UK Innovator Founder Visa business plan preparation to craft those insights effortlessly.
Applying These Frameworks in Your Innovator Visa Business Plan
Integrating growth accounting, cohort analysis and distribution into your business plan shows you’ve done more than sketch a vision. It proves you’ve built it, measured it and optimised it. Torly.ai takes these frameworks further by:
- Assessing business idea viability against Home Office benchmarks
- Analysing your background and expertise for endorsement readiness
- Identifying gaps and generating a clear action roadmap
Our 24/7 AI agents deliver customised charts, bullet-proof narrative and compliance checks. You’ll get a ready-to-submit plan that highlights your product-market fit and satisfies every endorsing body criterion. Go ahead and Assess Product Market Fit with our AI-Powered UK Innovator Visa Application Assistant to see these insights in action.
Testimonials
“Using Torly.ai’s analytics module transformed our application. We went from vague market claims to concrete growth charts in 48 hours, and we got endorsed first try.”
— Alex McIntyre, Fintech Founder
“I never thought cohort metrics were this powerful. Torly.ai’s AI agents helped me showcase retention in a way that really resonated with my endorsing body.”
— Priya Raman, HealthTech Entrepreneur
“As a small team, we lacked data science expertise. Torly.ai’s Desktop APP did the heavy lifting, and our visa application sailed through.”
— Samuel O’Neill, EdTech Startup CEO
Conclusion
Building a convincing Innovator Visa application demands more than ambition. You need quantitative proof of product-market fit. By using growth accounting, cohort analysis and distribution techniques, you present a data-driven story that endorsers trust. Torly.ai’s AI-Powered UK Innovator Visa Application Assistant wraps these frameworks into a seamless, 48-hour turnaround service with 95% success. Ready to make your case? Optimise Product Market Fit with our AI-Powered UK Innovator Visa Application Assistant