Model Evaluation and Metrics · May 12, 2026
Key Metrics for Evaluating AI-Driven Visa Application Models with Torly.ai
Equip yourself with essential scoring functions and evaluation metrics used by Torly.ai to quantify and improve the performance of your Innovator Visa readiness models.

Introduction: Why Rigorous Metrics Matter
Wondering if your AI can truly predict Innovator Founder Visa success? You need solid model evaluation metrics to know. These measures separate guesswork from genuine insight. They guide you through classification, calibration and regression. They shape your AI into an honest adviser.
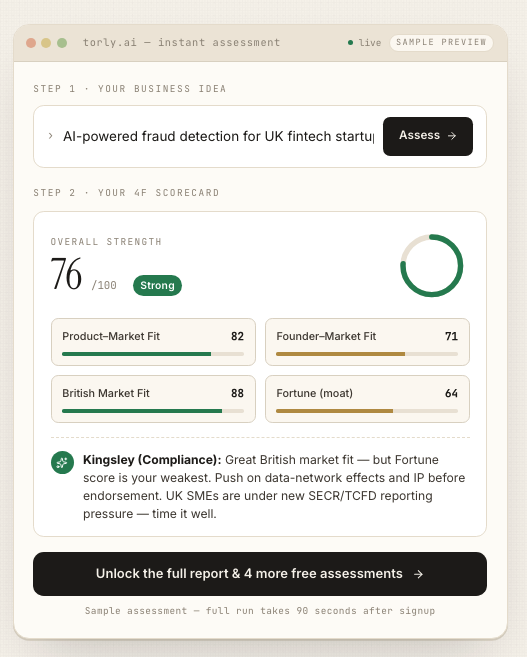
Torly.ai’s AI agents don’t simply spit out a score. They rely on best-in-class scoring functions, from log loss to ROC AUC to mean squared error, all tailored for visa readiness. Ready to see how? Discover model evaluation metrics with our AI-Powered UK Innovator Visa Application Assistant and turn data into decisive action.
Whether you’re assessing a business idea or gauging founder suitability, picking the right metrics ensures you move with confidence, not confusion. In this guide, we’ll unpack key approaches, show real-world examples, and illustrate how Torly.ai leverages these insights to boost endorsement chances.
Understanding Scoring Functions for Visa Model Readiness
Metrics aren’t magic. They’re truth serum that reveals how well your predictions align with reality. Before diving into specific functions, let’s look at two broad steps every AI system goes through.
- Predicting: You produce a point value or probability for a target (e.g. endorsement likelihood).
- Decision making: You convert that into an action (e.g. “approve” vs “revise”).
Strictly Consistent Scoring Functions
A strictly consistent scoring function rewards honesty. It ensures the best expected result comes from telling the truth about your predictive distribution. For regression, common choices include:
- Mean Squared Error (MSE) for average deviations.
- Mean Absolute Error (MAE) for robustness to outliers.
- Pinball Loss when targeting quantiles (e.g. worst-case gaps).
For classification you pick a proper scoring rule like:
- Log Loss (cross-entropy) to penalise overconfident mistakes.
- Brier Score for squared-error on probabilistic outputs.
Align your training loss and evaluation metric. That way, optimising during training directly improves the scoreboard you care about. This alignment is at the heart of Torly.ai’s model evaluation metrics strategy.
Why Proper Scoring Rules Matter
Ever tuned for accuracy only to discover your probabilities were useless? Proper scoring rules avoid that trap. They guide you to not just the right class, but the right confidence. That’s crucial when you need to advise a founder on realistic visa chances.
- Log Loss punishes improbable predictions that end up true.
- Brier Score breaks down into calibration (how close probabilities are to reality) and refinement.
By integrating these into Torly.ai, we ensure your Innovator Visa readiness model is both sharp and well-calibrated.
Classification Metrics: Measuring Endorsement Likelihood
When assessing an applicant’s endorsement chance, you’re doing binary classification: endorse or not. Here are the go-to metrics:
- Accuracy Score: Fraction of correct decisions.
- Precision & Recall: How reliably you identify true endorsement candidates vs false positives.
- F1 Score: Balances precision and recall.
- ROC AUC: Gauges discrimination across thresholds.
- Top-K Accuracy: Useful when ranking several candidates for limited spaces.
Example: Torly.ai’s classifier predicts a 70% chance of EB endorsement. Using ROC AUC, we test various thresholds to decide when to suggest “strong fit” vs “needs more work”. A high AUC means our system ranks true endorsements above false ones, every time.
Key Tips for Classification
- Use balanced accuracy on imbalanced datasets (rare endorsements).
- Tune your decision threshold rather than default to 0.5.
- Wrap critical metrics in cross-validation to ensure stability.
Now that you grasp classification metrics, it’s easier to push your visa model from “good” to “trusted”.
Calibration Metrics for Probability Estimates
Predicted probabilities must reflect real chances. Mis-calibrated models mislead founders. Torly.ai uses these metrics:
- Log Loss: Average negative log-likelihood; punishes overconfident mistakes.
- Brier Score: Mean squared error of probabilities; lower means better calibration.
- Reliability Diagrams: Visualise predicted vs actual probabilities.
- Expected Calibration Error (ECE): Quantifies mismatch between bins of probability and observed frequency.
Careful calibration tells a user, “You really do have 85% odds, no fluff.” That builds trust.
Ready to see calibration in action? Build your Business Plan NOW with the Torly.ai Desktop App and let our agents fine-tune every probability estimate for your Innovator Visa plan.
Regression Metrics for Readiness Scores
Sometimes you need continuous predictions, like expected time to endorsement or expected score on viability criteria. In those cases, apply regression metrics:
- Mean Squared Error (MSE): Sensitive to large errors; good for emphasising outliers.
- Root Mean Squared Error (RMSE): Brings units back to original scale.
- Mean Absolute Error (MAE): Robust to outliers; easy to interpret.
- R² Score: Proportion of variance explained; ideal when comparing models on the same dataset.
- Median Absolute Error: Useful if your data has heavy tails.
Imagine Torly.ai predicts “2.3 months” till endorsement. By tracking MSE, we measure average gap. By improving our feature set, we reduce that error and deliver sharper timelines to founders.
Ranking Metrics for Prioritising Improvements
When Torly.ai spots multiple gaps—market fit, team strength, tech stack—you need to rank them. For ranking tasks:
- Coverage Error: How many top items cover all true gaps.
- Label Ranking Average Precision (LRAP): Average fraction of better-ranked true labels.
- Label Ranking Loss: Fraction of incorrectly ordered label pairs.
- DCG/NDCG: Discounted cumulative gain for weighted importance of top slots.
These metrics help you decide which recommendation to surface first. A low ranking loss means fewer mis-prioritised suggestions.
Putting It All Together in Torly.ai
Torly.ai’s Innovator Visa readiness agent threads these metrics through every stage:
- Business Idea Qualification – Classification metrics to sort innovative, viable concepts.
- Applicant Background Assessment – Calibration metrics ensure probability estimates of endorsement are trustworthy.
- Gap Identification & Action Roadmap – Regression and ranking metrics to prioritise suggestions and track progress.
Every iteration runs cross-validation loops, logs scores, and triggers alerts when performance dips. Behind the scenes, Torly.ai continuously updates models, re-tunes thresholds, and recalibrates probabilities so entrepreneurs see real-world improvements.
Think of model evaluation metrics as your compass: they reveal drift, bias and blind spots. Torly.ai not only measures these compass readings but turns them into a clear roadmap for action.
Conclusion: Adopt Metrics for Continuous Improvement
Choosing the right model evaluation metrics transforms AI from black box to insightful partner. Whether you focus on classification, calibration, regression or ranking, each metric shines a light on a different aspect of performance.
By weaving these measures into your Innovator Visa process, you build models that not only predict but guide. Torly.ai exemplifies this approach with a suite of agents that monitor, assess and refine your application readiness in real time.
Ready to implement robust model evaluation metrics and boost your endorsement odds? Master model evaluation metrics with our AI-Powered UK Innovator Visa Application Assistant.