Metrics and Measurement · June 22, 2026
Key Product-Market Fit Metrics for a Winning UK Innovator Visa Application
Learn which product-market fit metrics endorsement bodies prioritise and how Torly.ai’s AI can track and present them for your Innovator Visa.

Unlocking Product Market Fit: Your Passport to Endorsement Success
Understanding Product Market Fit can feel like decoding hieroglyphics. Yet, for a UK Innovator Visa application, it’s your secret weapon. You’ll need to show endorsing bodies clear, data-driven proof that customers love your solution. No vague statements, no wishful thinking.
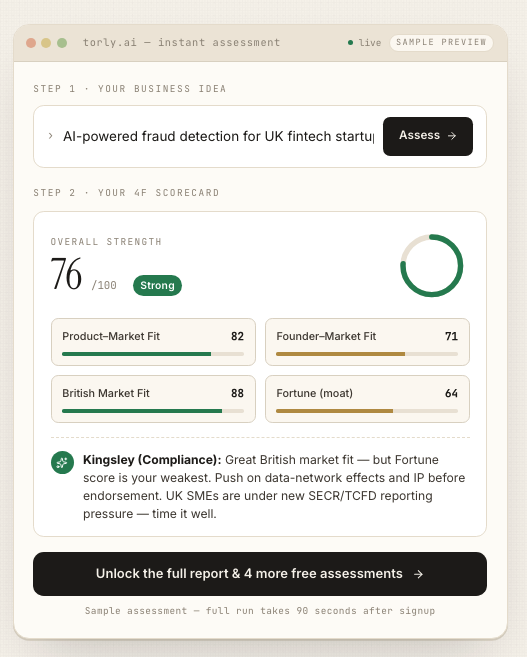
In this article, you’ll discover the top metrics that Home Office partners and endorsing bodies really care about. We’ll unpack each measure, from net promoter scores to retention rates, and show how Torly.ai’s AI-Powered UK Innovator Visa Application Assistant makes collecting, analysing and presenting these metrics second nature. Ready for smooth endorsement? Achieve Product Market Fit with our AI-Powered UK Innovator Visa Application Assistant
Why Product Market Fit Matters for Innovator Visa Approval
If you want an Innovator Visa, your business plan must show genuine traction. Endorsing bodies look beyond a slick pitch. They seek evidence that your product solves real pain points. That’s the essence of product-market fit.
Two things matter most:
- Customer adoption. Are real users paying, recommending and returning?
- Scalable growth. Can you replicate early success across the UK and beyond?
Without Product Market Fit, your application risks rejection. Even the most innovative idea struggles without proof of genuine demand. Data builds confidence. Metrics verify that you’re not chasing ghosts—you’re on a path to sustainable growth.
Top Metrics Endorsers Demand
Let’s break down the key metrics that turn an application from “nice idea” to “must endorse”.
1. Net Promoter Score (NPS)
What it is
A measure of customer satisfaction and loyalty. Calculated by asking users how likely they are to recommend your product on a scale of 0–10.
Why it matters
High NPS signals strong product-market fit. It shows you’ve nailed the core value and customers are evangelists, not just users.
How to track
• Run quick surveys after onboarding
• Automate NPS collection with email prompts
• Analyse trends monthly
Torly.ai can automate survey distribution and analyse NPS trends in one dashboard. No manual spreadsheets.
2. Early Revenue Growth
What it is
The speed at which your monthly or quarterly revenue increases.
Why it matters
Revenue growth is tangible proof of demand. Endorsers want to see a steep upward curve, not flat lines.
How to track
• Track Monthly Recurring Revenue (MRR)
• Segment by region or customer type
• Display graphs to show month-on-month gains
3. Customer Retention & Churn Rate
What it is
Retention rate measures how many users stay over time. Churn rate is the percentage that leave.
Why it matters
High churn means shallow fit. Endorsers worry your product solves a one-off problem but lacks long-term value.
How to track
• Cohort analysis in analytics tools
• Automated alerts when churn spikes
• Retention dashboards for different customer segments
4. Engagement Metrics
What it is
Actions such as daily active users (DAU), session length or feature usage frequency.
Why it matters
Engagement proves habitual use. If people engage daily, your product has embedded value.
How to track
• Integrate with Google Analytics or Mixpanel
• Set up custom events for key actions
• Monitor usage funnels
5. Referral & Virality Rate
What it is
Percentage of new users who join via existing customer referrals.
Why it matters
Word-of-mouth indicates genuine enthusiasm. A viral coefficient above 1.0 means each user brings in more than one new user.
How to track
• Track referral codes or links
• Analyse invitation-to-sign-up conversion rates
• Monitor viral loops
6. Unit Economics & Customer Acquisition Cost (CAC)
What it is
CAC is the cost to acquire one customer. Compare it to Customer Lifetime Value (LTV).
Why it matters
Healthy unit economics (LTV > CAC) signal sustainable growth. Endorsers want to know you can scale profitably.
How to track
• Automate ad spend and conversion tracking
• Calculate LTV based on purchase frequency
• Display CAC vs LTV over time
7. Market Sizing: TAM, SAM, SOM
What it is
• TAM: Total Addressable Market
• SAM: Serviceable Available Market
• SOM: Serviceable Obtainable Market
Why it matters
Shows you understand the wider opportunity and realistic reach.
How to track
• Use industry reports
• Survey potential users
• Combine internal and external data
How Torly.ai Elevates Your Product Market Fit Data
Collecting all these metrics can feel overwhelming. Here’s where Torly.ai shines:
• 24/7 AI-driven metric tracking
• Automated NPS and survey campaigns
• Real-time dashboards for revenue, churn and engagement
• Custom reports formatted for endorsing bodies
• Gap analysis to highlight weak spots
• Quick turnaround in under 48 hours
Thanks to advanced reasoning agents, you’ll not only gather numbers but also receive tailored improvement advice. No more guessing. You’ll know exactly which levers to pull to boost your Product Market Fit.
Curious? Discover Product Market Fit with our AI-Powered UK Innovator Visa Application Assistant
Bringing Metrics to Life: A Mini Case Study
Imagine a fintech startup, FinLink, seeking endorsement. They had an innovative P2P payments app but lacked data. Torly.ai stepped in:
- Automated NPS: Tripled response rate in two weeks
- Revenue Dashboard: Revealed a 30% month-on-month MRR lift
- Churn Analysis: Pinpointed a feature gap causing a 15% churn spike
- Referral Loop: Set up trackable referral links, boosting viral coefficient to 1.2
With these insights, FinLink crafted a rock-solid business plan. Endorsing body feedback? “Strong traction and clear metrics. Application approved.”
Pro tip: Start collecting data on day one. Even small samples impress when you present clear trends.
Practical Steps to Prepare Your Application
You don’t need to be a data scientist. Here’s your checklist:
- Choose tools for surveys and analytics
- Automate metric collection (e.g. dashboards, emails)
- Schedule weekly reviews of key KPIs
- Use cohort analysis for retention insights
- Compare CAC vs LTV and aim for LTV at least twice CAC
- Document your data sources and methods
- Present charts and bullet-point conclusions
Once you have this foundation, let Torly.ai refine your narrative and build a visa-ready plan.
Need a hands-on builder? Grab the TorlyAI Desktop APP to fine-tune your metrics
Common Pitfalls and How to Avoid Them
• Over-aggregation—too many metrics can confuse. Focus on the top 3.
• Ignoring qualitative feedback—combine surveys with interviews.
• One-off spikes—smooth out data with rolling averages.
• No context—always compare to industry benchmarks.
Torly.ai flags these pitfalls and guides you step by step. Your data story will be clear and compelling.
Ready to map out your plan? Start to Build your Business Plan NOW with TorlyAI
Wrapping Up: Secure Your Endorsement with Data
Product Market Fit is not a buzzword. It’s the proof endorsers need that your startup will thrive. By focusing on NPS, revenue growth, churn, engagement and unit economics, you build an application that stands out.
With Torly.ai’s AI-powered assistant, you’ll automate metric tracking, receive tailored recommendations and assemble a bullet-proof business plan. No more guesswork. Just data-driven confidence.
Take control of your Innovator Visa journey today. Start your journey to Product Market Fit with our AI-Powered UK Innovator Visa Application Assistant