Examples · June 23, 2026
Visualising Product-Market Fit for Your UK Innovator Visa Application
Learn how Torly.ai’s Innovatorly Matrix brings PMF to life with intuitive visuals, ensuring your UK Innovator Visa stands out.

Discover the Power of Market Fit Analysis with Stunning Visuals
If you’re aiming to secure a UK Innovator Visa, you already know how pivotal Product-Market Fit is. Yet “fit” can feel abstract, even elusive. That’s where Market Fit Analysis steps in, turning gauzy concepts into clear, actionable insights. We’ll show you why visualising this analysis matters, and how it can transform your Innovator Visa application from generic to compelling.
Whether you’re refining your business plan or lining up endorsements, you need proof that your idea solves a real problem. By pairing data with intuitive charts, you’ll speak your endorsing body’s language and highlight your venture’s true potential. Ready to level up your application? Explore Market Fit Analysis with our AI-Powered UK Innovator Visa Application Assistant
In the next few sections we’ll unpack:
- What Market Fit Analysis actually means, beyond buzzwords.
- How Torly.ai’s Innovatorly Matrix brings it to life.
- Practical examples of feedback loops, pivot decisions and iteration.
Let’s dive straight in and see how a few well-crafted visuals can make all the difference.
What Is Market Fit Analysis and Why It Matters
Market Fit Analysis is more than a checkbox on your to-do list. It’s your roadmap to proving that your product or service will thrive in a great market. Andy Rachleff coined the concept and Marc Andreessen popularised it, stressing the idea that “in a great market, the market pulls the product out of the startup”.
If your application is overloaded with text but lacks clarity on market need, you’ll struggle to convince endorsing bodies. That’s where visual analysis helps:
- Identify market segments most hungry for your solution.
- Map customer needs to specific features.
- Track adoption metrics and pivot triggers.
With Market Fit Analysis front and centre, you’re not guessing. You’re showing hard evidence. This clarity boosts confidence in your Innovator Visa endorsement and gives you a blueprint for growth once you land in the UK.
Torly.ai’s Innovatorly Matrix: Seeing Product-Market Fit in Action
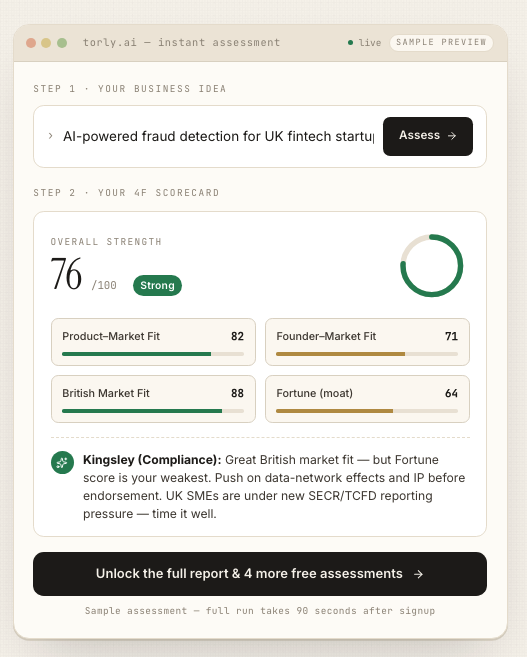
At Torly.ai we built the Innovatorly Matrix to give you precise, visual PMF insights. It’s an AI-powered dashboard that assesses three critical dimensions:
- Business Idea Qualification
– Evaluates innovativeness, viability and scalability against Home Office and endorsing body benchmarks. - Applicant Background Assessment
– Analyses your experience, expertise and entrepreneurial track record to gauge endorsement readiness. - Gap Identification & Action Roadmap
– Highlights weaknesses in your model and suggests concrete steps to strengthen market alignment.
Imagine a colour-coded grid where green ticks show areas of strength and amber markers pinpoint sections that need extra data or interviews. It’s not guesswork; it’s targeted feedback at scale.
Once you see exactly where your venture aligns with market demand, you can refine your pitch and business plan. And speaking of plans, Torly.ai offers a seamless way to build yours. Build your business plan now with TorlyAI Desktop APP
How the Matrix Boosts Your Innovation Narrative
- Instant scoring: Know your standing in seconds, not weeks.
- Real-time updates: As you tweak assumptions, your visuals update automatically.
- Data stacking: Layer survey results, competitor analysis and pricing tests in one place.
When you submit your Innovator Visa application, you won’t just claim “we fit the market”. You’ll prove it, slide by slide.
Real-World Examples of Feedback Loops
Product-Market Fit isn’t a one-off milestone. It’s a continuous cycle of learning, iterating and validating. Let’s look at three feedback loops popularised in startup circles:
1. Customer Interviews and Surveys
Sit down with early adopters. Ask open questions:
- What problem are you solving right now?
- Which features matter most?
- How much would you pay?
Visualise the results in bar charts to spot patterns. If 60% of respondents rank Feature A as “essential”, that’s a green light to prioritise development.
2. Usage Metrics and Behavioural Data
Track onboarding flows, drop-off rates and churn:
- Use funnels to see where users get stuck.
- Overlay time-on-page heatmaps to detect friction points.
- Compare cohorts before and after feature releases.
A sudden spike in drop-off after a new sign-up step? Time to pivot or simplify.
3. A/B and Pricing Experiments
Test new interfaces, price points or messaging:
- Randomly assign users to Variant A or B.
- Measure conversion rates and lifetime value.
- Plot the uplift to decide your winner.
Graphs make it clear if a 10% discount yields 30% more sign-ups. That’s gold for your Innovator Visa panel—they’ll see you know how to drive growth.
Step-by-Step Guide to Conducting Your Market Fit Analysis
Ready to roll up your sleeves? Here’s a simple workflow:
- Define your core hypothesis
– e.g. “Freelancers need an AI-powered project manager.” - Identify early adopter profiles
– Create customer personas: age, sector, pain points. - Run qualitative interviews
– 5–10 in-depth chats and note recurring themes. - Launch a minimal survey
– Use ranking scales to quantify interest. - Visualise results in Innovatorly Matrix
– Green ticks, amber flags, red alerts. - Iterate product or pivot focus
– Address amber/red areas with specific solutions.
Halfway through these steps, you’ll want an AI companion to speed things up. Discover Market Fit Analysis with our AI-Powered UK Innovator Visa Application Assistant
Avoiding Common Pitfalls in PMF Visualisation
You’ve gathered data but your charts look messy. Here’s how to stay on track:
- Don’t overload slides with text. Use clear legends and colour codes.
- Focus on actionable metrics: adoption, retention and advocacy.
- Keep sample sizes realistic but not misleading. Always note N-values.
- Label everything: axes, data points and timeframes.
A sloppy visual can undermine your credibility. With Torly.ai’s dashboard, templates and guidance, you’ll never stress over design inconsistencies.
Measuring Success and Iterating for Endorsement
After submission, the work isn’t over:
- Track your metrics in real time.
- Update your Innovatorly Matrix to reflect new feedback.
- Share monthly snapshots with your endorsing body if requested.
Seeing continuous improvement signals to endorsers that you’re serious about scaling. And if policy shifts or market dynamics change, you’ll have the agility to adapt.
Testimonials
“Torly.ai turned our vague assumptions into crystal-clear charts. We saw our gap areas and filled them within days. No more guesswork.”
— Priya Singh, Founder of EcoTech Solutions
“I never thought data visualisation could be so straightforward. The Innovatorly Matrix gave me confidence to apply, and I got my endorsement first time.”
— James Thompson, CEO of GreenPulse Analytics
“Having 24/7 AI support meant I could refine my business plan at 2 am. The instant feedback loop saved us weeks of back-and-forth.”
— Amina Patel, Co-founder of HealthBridge UK
Conclusion: Bring Your Visa Application to Life
Market Fit Analysis is your secret weapon. By turning market insights into vivid visuals you’ll speak directly to endorsers and Home Office reviewers. Torly.ai’s Innovatorly Matrix and AI-powered assistant streamline every step:
- In-depth market research and customer profiling
- Automated gap detection and action plans
- Dynamic visual dashboards that update in real time
Ready to transform your Innovator Visa journey? Launch your endorsement application with 6 AI agents using TorlyAI BP Builder APP
With clear charts, bullet-proof data and AI assistance, you’ll not only meet requirements, you’ll stand out. Experience Market Fit Analysis with our AI-Powered UK Innovator Visa Application Assistant