From business idea
to UK Innovator Founder Visa
endorsement.
Validate your idea free in five minutes — then build your endorsement-ready plan inside the Claude you already use, or on Desktop.
TorlyAI Visa Master —
now inside Claude.
The full Innovator Founder Visa toolkit, inside the Claude you already use.
Three steps between you
and an endorsement letter.
One workspace for the whole endorsement journey, built on the frameworks endorsing bodies actually use.
Type your idea, get an instant 4F score against Home Office innovation criteria. Five free runs.
Six AI agents draft your business plan, financial model and evidence pack on the Torly desktop app.
We match your endorsing body, run mock interviews and assemble your submission bundle. You press send.
Run one free assessment and your readiness dashboard fills in.
Score, 4F breakdown, and every tool that unlocks — all in one place. No card required.
Six specialists. One endorsement.
Each owns a phase, shares context, hands off — consultancy work at 1/30th the cost.


Numbers that get you endorsed —
and settled.
Answer ~11 plain questions. Hermione returns a 36-month I-P-O-C model — P&L, cash flow and unit economics — plus the only ILR Settlement Readiness scorecard anywhere.
Your application,
end-to-end.
Where the real work happens. Five tools take you from first draft to endorsement interview.
Everything you need, nothing you don't.
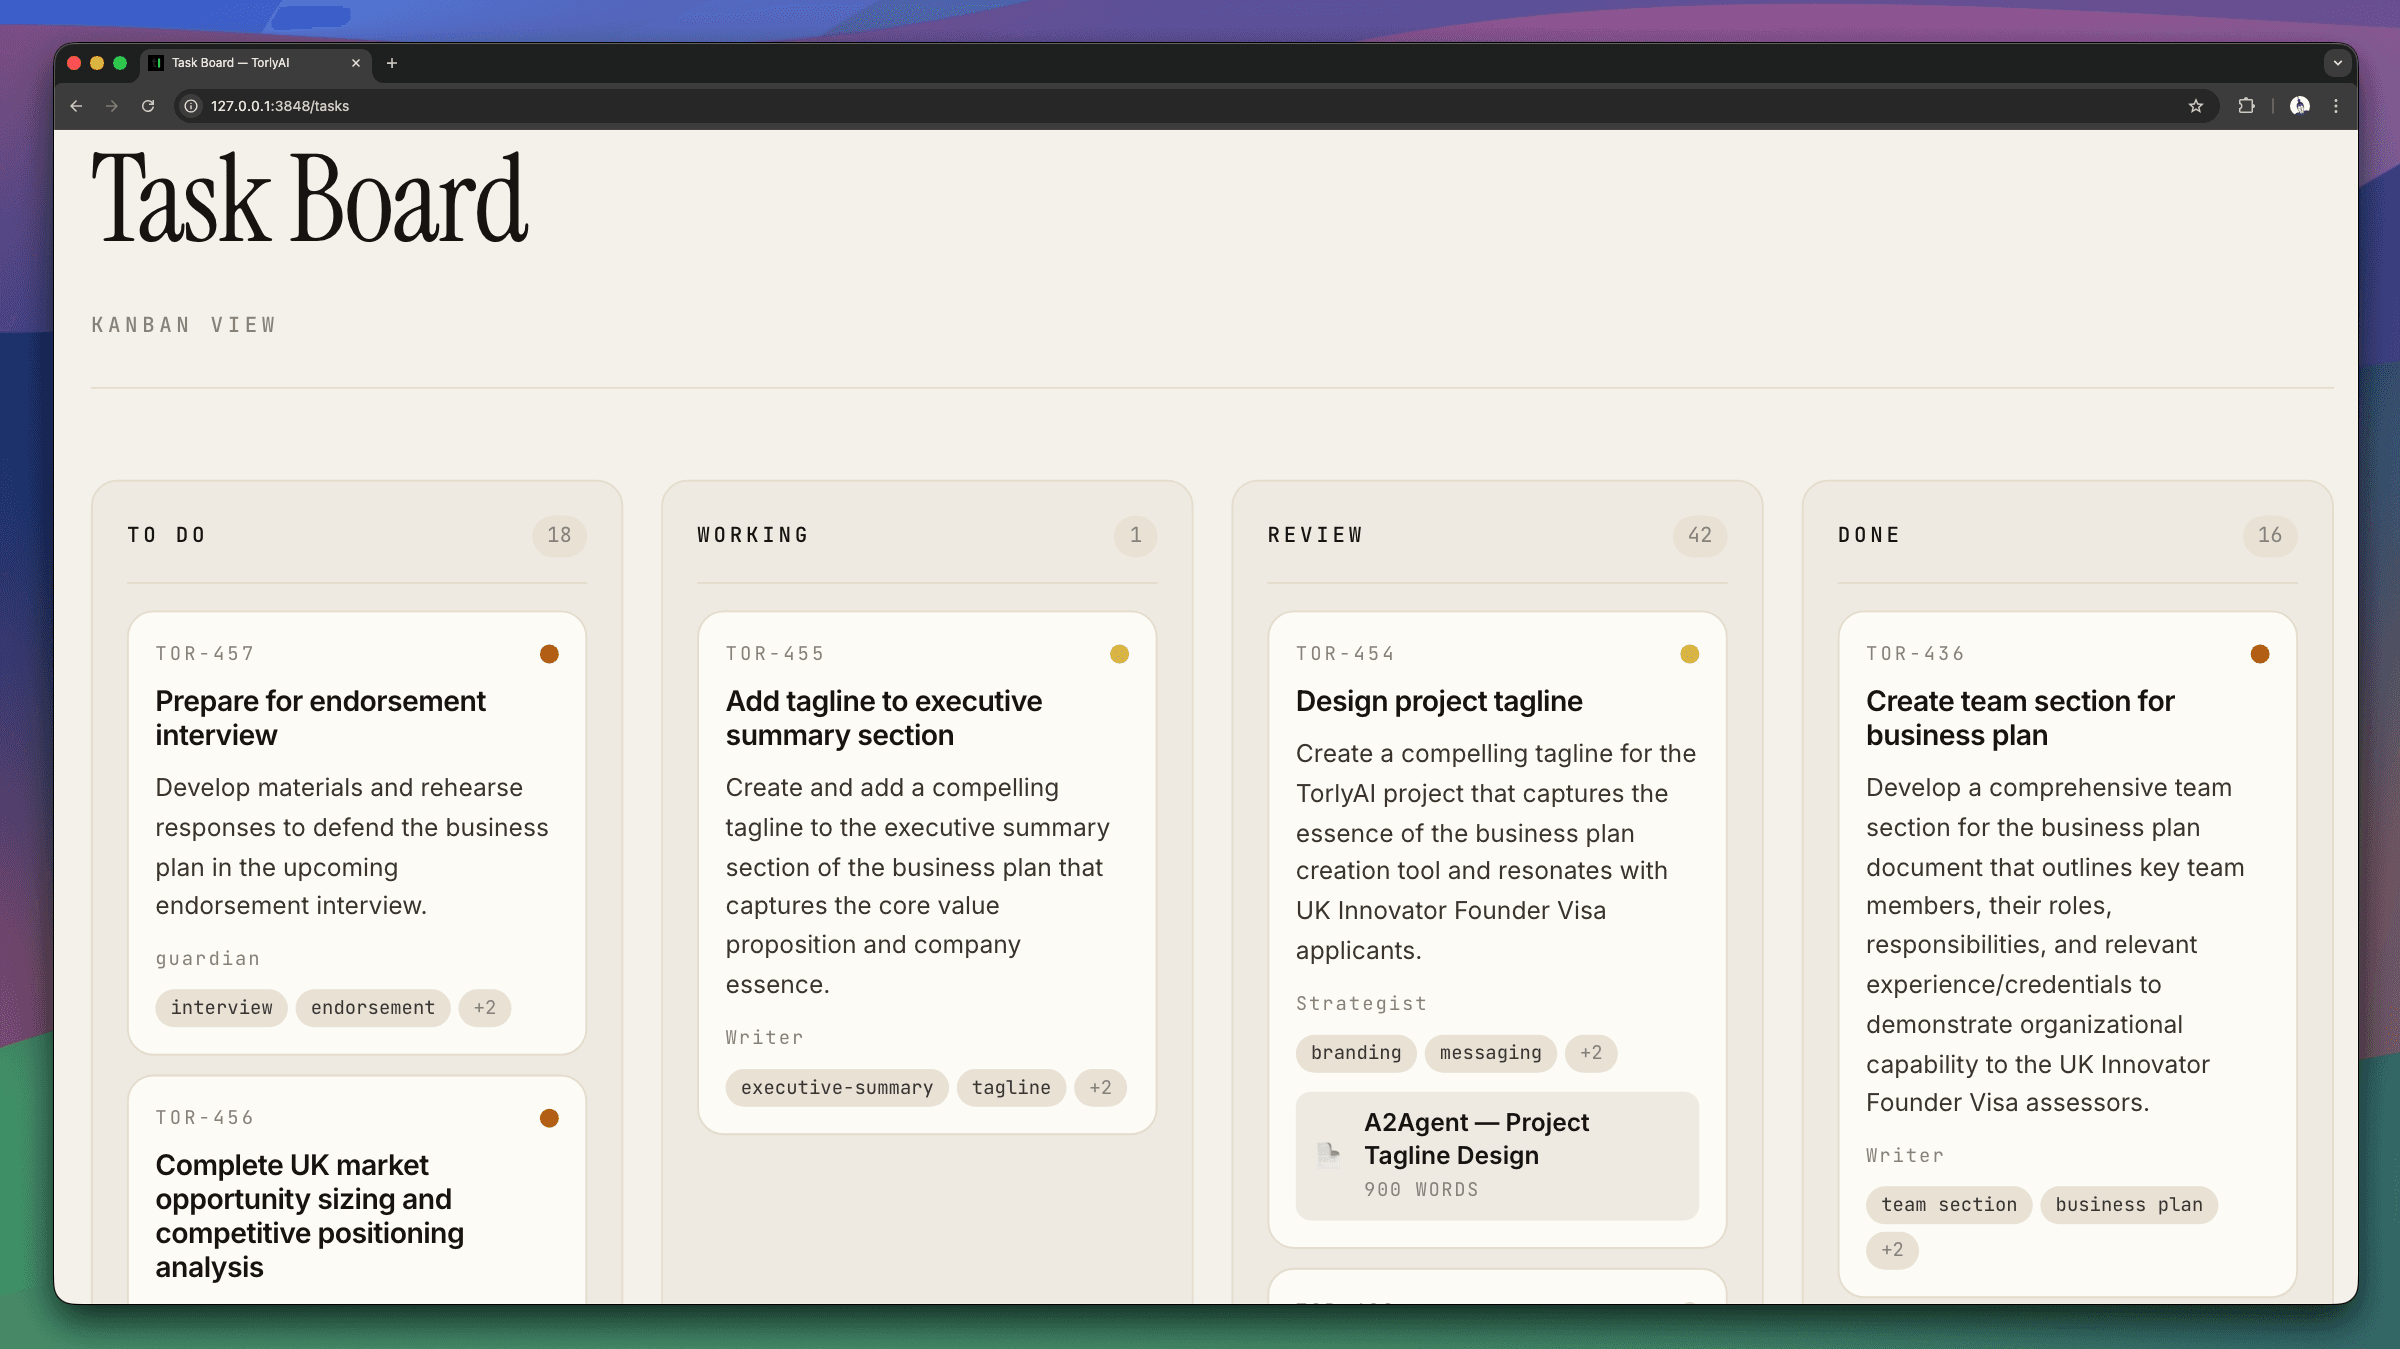
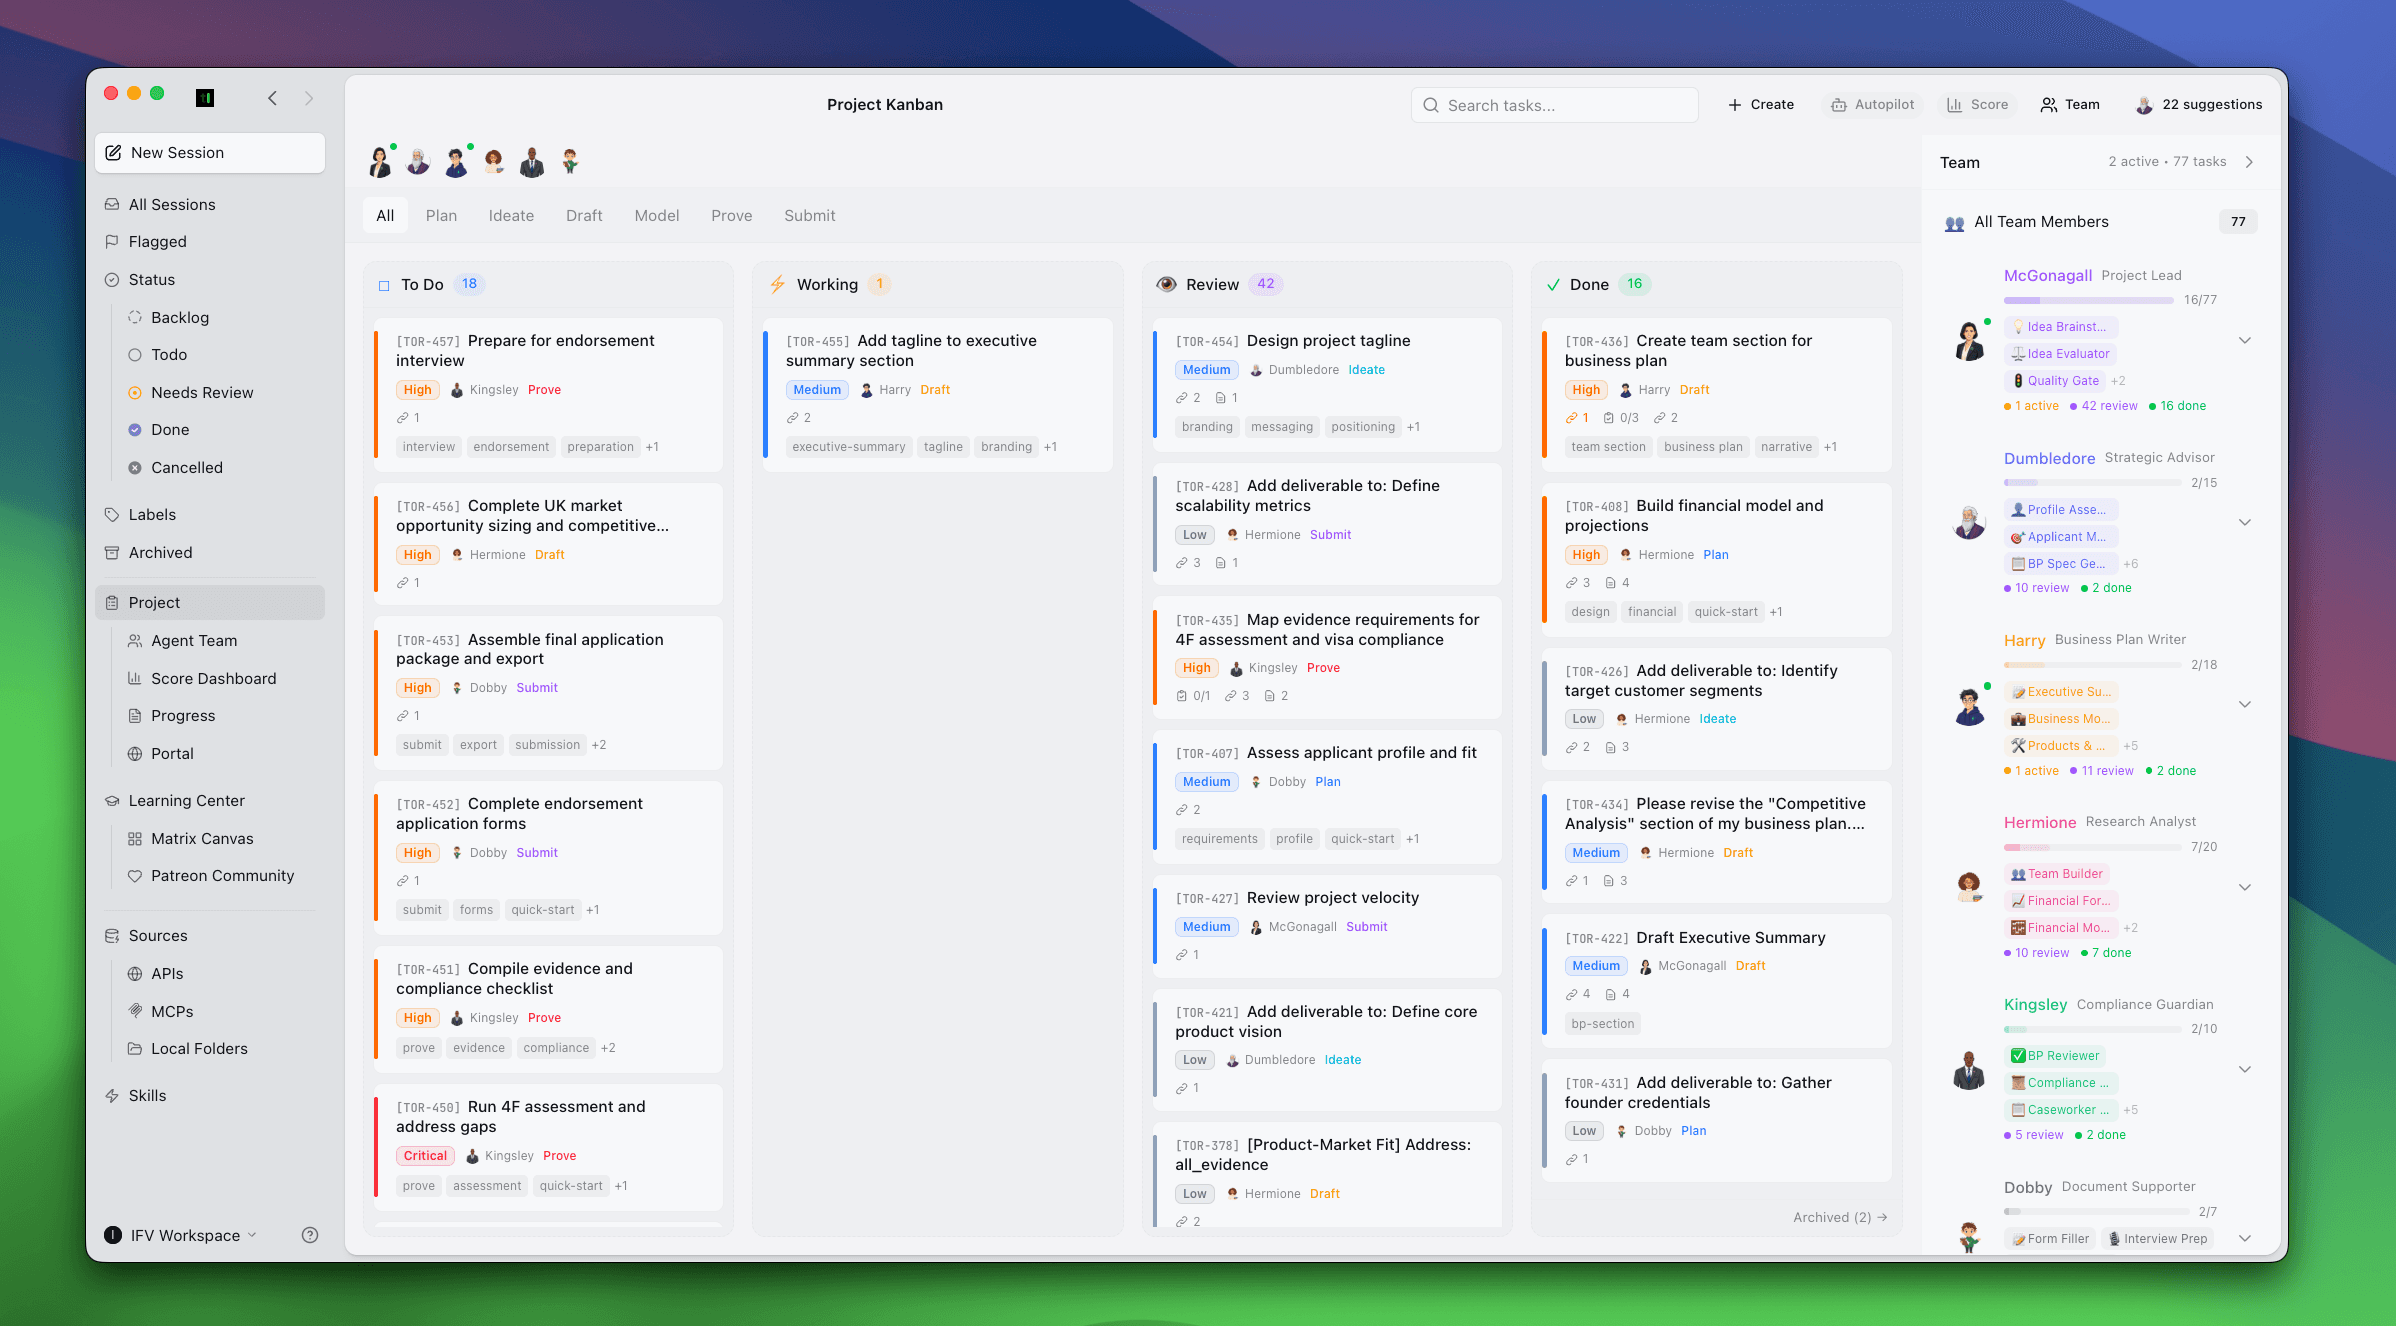
Kanban for your whole application
Every deliverable is a card your agents move To Do → Done.
A plan for wherever
you are on the journey.
From learning the route for free to a done-for-you submission. Immigration solicitors charge £4–15k for a business plan — Torly Premium is £79/month, and you can stop the day you submit.
New to the Innovator Founder Visa? Learn how it all works, free.
Already use Claude? Pressure-test your idea and validate your next moves.
Add to ClaudeGoing for endorsement? Get your letter as fast as possible.
Too busy to prepare it all? A human + AI team builds it for you.
Questions, honestly answered.
Start your UK Innovator Founder Visa
in the next five minutes.
Type your idea. See your 4F score. You'll know immediately if we can help.